


please send a mail
-->here<--
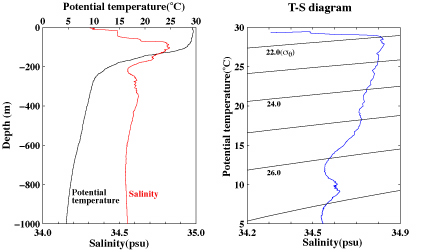
The left figure shows the vertical distribution of temperature and salinity in the western equatorial Pacific and the right figure shows the T-S diagram of those. These data are CTD data and were obtained from JAMSTEC, Japan. The salinity had a large vertical gradient from the surface to about 20m while the temperature from the surface to about 100m was almost uniform. The salinity was almost uniform between 20 and 50m but it had a large vertical gradient again below 50m. It is fairly typical that the vertical extents of an isothermal layer and an isohaline layer do not match in the western tropical Pacific and it is a subject of some active researches because it might have some significant influences on the occurrence of El Nino.
We reserve the copyrights of all the figures shown in our web site. If you want to pass(send a copy) our figures to the third-party, we ask you to do so without getting any thing, either money, goods, preferences and/or anything, in return. Also, we ask you to notify the status of the copyrights of our figures to that third-party. If you want to use entire or parts of our figures, we ask you to show the origin and the status of the copyright explicitly in your documents where our figures are going to be used. We appreciate very much if you let us know your usage of our figures in that case.
Thank you.
CRInternational