


please send a mail
-->here<--
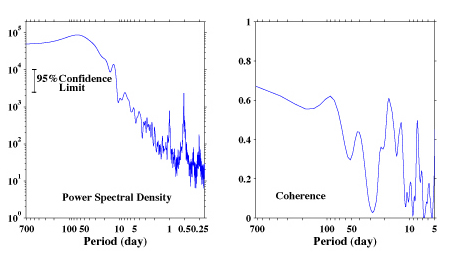
The left figure shows power spectral density function of zonal(east-west) current at 40m at 0N-165E. This figure clearly indicates that the tidal components are very strong at this location. There is a broad peak at 70- to 80-day period and the energy decreases toward at shorter periods. Since these data were obtained right on the equator, there is no inertial period (infinite). The right figure, the coherency between this zonal current and zonal wind stress (NCEP reanalysis) at this location, shows that coherency is higher than 0.5 at several period bands. It is typical that the coherency between zonal wind stress and zonal currents near the surface to about 100m is high in the western equatorial Pacific due to the unique physical oceanographic characteristics of the equatorial ocean.
We reserve the copyrights of all the figures shown in our web site. If you want to pass(send a copy) our figures to the third-party, we ask you to do so without getting any thing, either money, goods, preferences and/or anything, in return. Also, we ask you to notify the status of the copyrights of our figures to that third-party. If you want to use entire or parts of our figures, we ask you to show the origin and the status of the copyright explicitly in your documents where our figures are going to be used. We appreciate very much if you let us know your usage of our figures in that case.
Thank you.
CRInternational